Wave Structure Supportive of Short-Term Bounce
Another down day. Some analysts with expensive subscriptions are calling for further lows into early next week. I’m not so sure and here’s why………..
Weve had 7 consecutive lower closes and are now due for a shallow pullback. I am confident of a let up in this relentless selling for a couple of very good reasons.
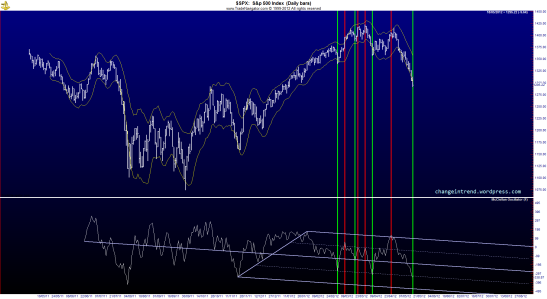
The first reason is the current wave structure of this move down since the early May peak. With reference to the below chart it is clear to see that we are currently on a wave 3 of 5 down into the projected June low. Normally this would require a wave 4 up followed by a larger wave 5 down into a major low. The interesting point regarding the current wave structure is the movement of wave 0-1 and from 2-3 is of a precise equal measurement or better known as a measured move which has thus far been constrained by the downward sloping Andrews Pitchfork.
Further analysis of the pitchfork shows that price has respected the middle fork and now broken down to the lower fork. At some point however the price will have to retest the middle fork before moving down into its June low and penetrating the lower fork line.
Also, it is interesting to note that the move from wave 3 low into a wave 4 high is half the measured moved from 0-1 and 2-3. Therefore this projection is showing that it is a geometrically sound representation of price and time movement. The wave 4 peak is also supported by longer term support/resistance trend lines which has shown that the precise angles of the trend lines have led to important support and resistance levels.
Looking at the final wave in this 5 wave structure, you can see that the initial measured moved has been projected downwards into the June time frame which is supported by the lower Andrews Pitchfork line, long term geometric support and also an earlier gap at around 126.40.
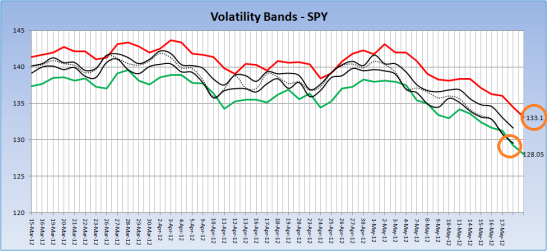
Im not quite done there either. Lets look at the latest reading from the volatility bands. These volatility bands are a method i developed to encapsulate price movement within a precise range. A move towards the upper resistance line is bearish whilst a move to support is bullish. On Friday the bands are showing that we clipped the lower support area. I advise strongly to make a note of these levels and draw the support and resistance levels on your own charting packages for daily reference.
Notice the Mondays upper resistance band reading 133. Now look back at the chart above to the wave 4 high. It is exactly at 133. An example of geometric price and time confluence. So my plan is pretty clear, reload to go short at just below 133.
The final piece of analysis involves some simple Andrews Pitchfork work on the McClellan Oscillator. The McClellan Oscillator for those who don’t know of it, is a breadth indicator derived from Net Advances, the number of advancing issues less the number of declining issues. Subtracting the 39-day exponential moving average of Net Advances from the 19-day exponential moving average of Net Advances forms the oscillator.
As can be seen in the chart below the McClellan Oscillator is currently trading in a side ways downwards sloping channel. Respect of the channel lines has historically given very accurate buy and sell signals. The current signal is suggesting that we could bounce here back to the mid fork line.
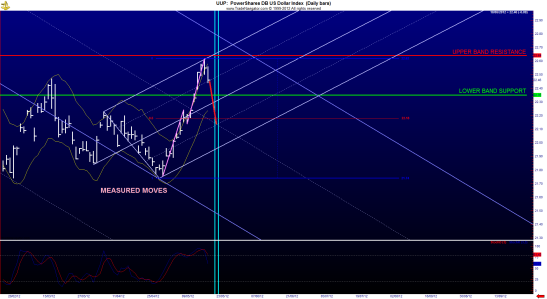
The dollar we all know has had a meteoric rise and has recently pulled back and shown in yesterdays post, in despite of equities posting a lower low. I expect that this is just a case of the dollar being preemptive of an equities rally. The dollar chart dollar is again an example of geometric position playing out in equities prices. A measured move from the 01 May low projected to 09 May peak, projected from 10 May low gives the precise target of the 17 May high. The lower green support band is also sitting at half the measured move projection so i expect a test of at least the 22.35 level, although it is very possible and likely that this weakness will prevail into 22-23 May to retest the 50% fib retracement, coinciding with an equities short term high (wave 4 in the first chart).
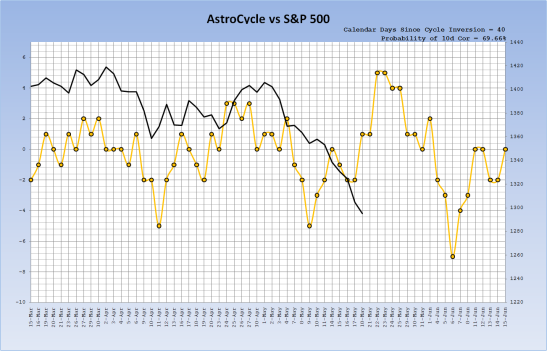
Finally, lets take another look at the Astro Cycles and the Natural Cycle.
I am convinced that the yearly cycle low is not yet in place and that we are due one more leg down into early June where i am expecting a choppy consolidation before moving higher. The natural cycle has historically bottomed early to the AstroCycle and is now showing a move up into late May which at this point i would question due to the AstroCycle and also the 5 wave structure highlighted in the first chart. The low is clearer however in terms of cyclical analysis and geometric technical analysis for the 1 st week in June.
I believe that the Facebook IPO went someway towards explaining the stretched cycle and pushed a low out to the next time window of 17-18 May.
My plan for the early next week is clear based on the above analysis, i plan to take a short trade in the 21-22 May window providing price targets have been met at the upper resistance band of around 133.00 on the SPY.
Enjoy the weekend
Anthony


Thanks stock0711 will be interesting to see how price acts at wave 4 resistance, but lets get there first.
thank you
Thanks,Excellent Roadmap Good Luck